DataViz examples
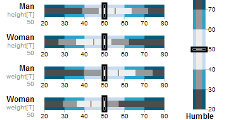
| 1 | BulleT | d3 / d3.chart.js |
An individual score represented above the population background while sample parameters ground for comparison. This chart is a variant based on mbostock's bullet. Miso's d3.chart.js was used as well. |
 |
|||
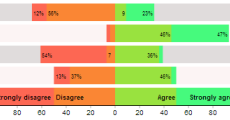
| 2 | Likert | d3 / d3.chart.js | My answer to Ann K. Emery 's Dataviz Challenge #5. Data/color order are changed because of some "psychological reason". |
 |
|||